②閉鎖空間での感染リスクを考える上で重要な指数はQuantum generation rateであり、Wells–Rileyの方程式は重要な情報を提供する。
感染症の基本となる疫学モデルとしては、SIR(Susceptibles-Infectors-Removed)または、SEIR(Susceptibles-Exposed-Infectors-Removed)モデルが用いられるが、感染力(または伝達係数)β(=Driving Force)の大きさを示すスカラー値としては、Quantumが用いられる(quantumは理論上の物理量)(9)。quantum generation rateは、感染性期間(Infectious Period: IfP)にある状態の患者(無症候性、もしくは有症候性患者)一人あたりが呼吸により発生させる単位時間あたりの感染性飛沫の数を示す(通常、Q (quanta) / hで表現)。1Qは、(1-1/e)x 感受性者(S)に感染を引き起こすことができる感染性飛沫数を示す。これらを用いて、閉鎖空間における感染確率Pは以下の方程式(Wells–Riley equation)で表現される(9,10)。

P: 感染確率
D: ある閉鎖空間における新たに発病に至る患者数
S: ある閉鎖空間における感受性者の総数
I: ある閉鎖空間における感染性期間(IfP)にある感染者数
p: 一人あたりの換気量(m*3/s)
q: 感染者一人あたりのquantum産生率(quanta/s)
t: 暴露時間(s)
Q: 外部からの換気量 (Q=AV (m*3) : Aは換気回数/s, Vは閉鎖空間の体積)
また、新規発病感染者数Nc(=D)は以下のように書き換えができる(D=SP)。

感染率λ=Iqp/Q(β=qp/Q)と置き換え、微小時間dtで新規発病患者が一人以上発生しない状況を想定すると、①一人の患者が発生する事象(確率 = βSIdt= λSdt)、②一人も患者が発生しない事象(確率 = 1−λSdt)の2事象の結末が考えられる。時間tにおいて感受性者Sが存在する確率をPs(t)とおくとPs(t+dt)は以下の確率漸化式で表すことができる(11)。
Ps(t+dt) = Ps(t)(1−λSdt)+Ps+1(t)λ(S+1)dt
∴Ps(t+dt)−Ps(t)= λdt(−Ps(t)S + Ps+1(t)(S+1))
Ps(t+dt)−Ps(t)/dt = λ(−Ps(t)S + Ps+1(t)(S+1))
よってPs(t)の時間微分方程式は、
dPs(t)/dt = −λSPs(t) + λ(S+1)Ps+1(t) となる、
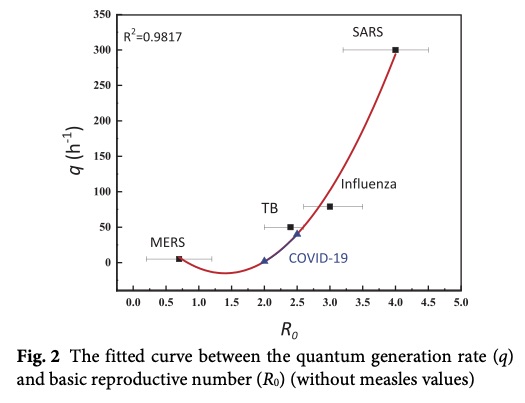
COVID19のquatum generation rateを推計した報告はほとんど見当たらないが、DaiらはRo=2.0-2.5として、Qcovid-19=14〜48 /hと算出している(11)。

また、無症候性患者が公共施設内で軽度の運動をする場合、Qcovid-19 = 10.5~33.9/hと算出されている(12). また、サージカルマスクによる感染力のフィルタリング効果は、約60%と見積もられている(13)。
Quantum Emission Rate (ERq)、ERqとSEIRとの接続、換気回数と感染リスクに関してはpart2にアップします。
Uploaded on November 28, 2020.
参考文献
1. Yang W, Marr LC. Dynamics of Airborne Influenza A Viruses Indoors and Dependence on Humidity. PLoS ONE 2011; 6(6): e21481. doi:10.1371/ journal.pone.0021481
2. Morawska L. Droplet fate in indoor environments, or can we prevent the spread of infection? Indoor Air 2006; 16: pp335–347.
3. Wells WF. On air-borne infection. Study II. Droplet and droplet nuclei. Am J Hyg 1934; 20: pp611–618.
4. McCluskey, R., Sandin, R, et al. Detection of airborne cytomegalovirus in hospital rooms of immuno compromised patients. J Virol Methods 1996; 56: pp115–118.
5. Fiegel J, Clarke R, et al. Airborne infectious disease and the suppression of pulmonary bioaerosols. DDT 2006; 11(2): pp51-573.
6. Duguid JP. The size and the duration of air-carriage of respiratory droplets and droplet-nuclei. J Hyg(Lond) 1946; 44(6): pp471-479.
7. Liu Y, Ning Z, et al. Aerodynamic analysis of SARS-CoV-2 in two Wuhan hospitals. Nature 2020 ; 582: pp557–560.
8. Ji W, Zhao B. Contribution of outdoor-originating particles indoor-emitted particles and indoor secondary organic aerosol(SOA) to residential indoor PM2.5 concentration: A model-based estimation. Build Environ 2015; 90: pp196–205.
9. Atkinson J, Chartier Y, et al. Natural ventilation for
infection control in health-care settings. WHO Publication/Guidelines. World Health Organization 2009.
10. Riley EC, Murphy G, et al. Airborne spread of measles in a suburban elementary school. Am J Epidemiol 1978, 107(5), pp421-432
11. Dai H, Zhao B. Association of the infection probability of COVID-19 with ventilation rates in confined spaces. BUILD SIMUL 2020:13; pp1321–1327.
12. Buonanno G, Stabile L, et al. Estimation of airborne viral emission: Quanta emission rate of SARS-CoV-2 for infection risk assessment. Environ Internat 2020; 141: 105794.
13. Hui D, Chow BK, et al. Exhaled Air Dispersion during Coughing with and without Wearing a Surgical or N95 Mask. PloS one, 7(12). 10.1371 / journal. pone. 00508456.